Results overview
In this post, I’m going to evaluate what increase of performance we could expect from using APC (Alternative PHP Cache).
APC is a opcode cache. That means that with APC, the PHP executable that is embedded in each apache process does not have to compile in opcode each PHP script.
The opcode is compiled during the first execution and is maintained in a shared memory area, so the successive php executions can get directly the opcode from the memory for each new request. In theory, we gain the time to compile from PHP script to opcode for each successive request.
Installing APC
Installing APC is very easy and can be done with just one command
aptitude install php-apc
To check if APC is correctly installed, create a php file in the root directory of the WordPress site that contains:
<?php
print_r(apc_cache_info());
?>
Then access this page. If you see an array of values, it works.
Evaluate the influence of using APC on the front for the raw throughput
Again, the following results are obtained for a particular workload (accessing the home page of a WordPress blog with few posts). It is obvious that the results can be very different for a workload that generates more database requests.
In this post, I continue the series of tests that I presented in the “CPU and RAM influence on the fronts” post.
I am doing the same tests (ab execution) in the exact same configuration (same database size, same IT resources).
Test #7, APC activated, 1 Front, 1Vcpu, 2GB on server ade-esxi-02 (Intel(R) Core(TM) Quad CPU Q6600 @ 2.40GHz; No Hyperthreading; 8 GB DDR2 800) :
$ ab -kc 10 -n 20 http://tu-web-01/mysite/
Requests per second: 3.49 [#/sec] (mean)
This is ApacheBench, Version 2.3
Copyright 1996 Adam Twiss, Zeus Technology Ltd, http://www.zeustech.net/
Licensed to The Apache Software Foundation, http://www.apache.org/
Benchmarking tu-web-01 (be patient).....done
Server Software: Apache/2.2.22
Server Hostname: tu-web-01
Server Port: 80
Document Path: /mysite/
Document Length: 47897 bytes
Concurrency Level: 10
Time taken for tests: 5.729 seconds
Complete requests: 20
Failed requests: 16
(Connect: 0, Receive: 0, Length: 16, Exceptions: 0)
Write errors: 0
Keep-Alive requests: 0
Total transferred: 968936 bytes
HTML transferred: 957916 bytes
Requests per second: 3.49 [#/sec] (mean)
Time per request: 2864.700 [ms] (mean)
Time per request: 286.470 [ms] (mean, across all concurrent requests)
Transfer rate: 165.15 [Kbytes/sec] received
Connection Times (ms)
min mean[+/-sd] median max
Connect: 0 1 1.4 0 4
Processing: 2241 2780 276.8 2916 3484
Waiting: 1625 1941 198.5 1993 2500
Total: 2245 2782 276.1 2916 3484
Percentage of the requests served within a certain time (ms)
50% 2916
66% 2928
75% 2964
80% 2988
90% 2996
95% 3484
98% 3484
99% 3484
100% 3484 (longest request)
dstat shows that the CPU hits 100% (0% Idle)
usr sys idl wai hiq siq:usr sys idl wai hiq siq| recv  send| read  writ| int   csw | used  buff  cach  free| 1m   5m  15m |run blk new| used  free|     time
 64   8  27   0   0   1: 64   8  27   0   0   1| 513k   26k|   0     0 | 372   458 | 335M 23.1M  145M 1501M|3.19 0.98 0.60| 10   0   0|   0   508M|22-08 15:17:52
 88  11   0   0   0   1: 88  11   0   0   0   1| 353k   93k|   0     0 | 628   849 | 382M 23.1M  145M 1453M|3.19 0.98 0.60| 10   0   0|   0   508M|22-08 15:17:53
 95   4   0   0   0   1: 95   4   0   0   0   1| 427k  470k|   0     0 | 717   585 | 389M 23.1M  145M 1447M|3.74 1.13 0.65| 10   0   0|   0   508M|22-08 15:17:54
 83  16   0   0   0   1: 83  16   0   0   0   1| 386k   88k|   0     0 | 582   549 | 349M 23.1M  145M 1486M|3.74 1.13 0.65| 10   0   0|   0   508M|22-08 15:17:55
 92   7   0   0   0   1: 92   7   0   0   0   1| 380k  155k|   0    16k| 854   880 | 382M 23.1M  145M 1453M|3.74 1.13 0.65| 10   0   0|   0   508M|22-08 15:17:56
 90   9   0   0   0   1: 90   9   0   0   0   1| 263k  461k|   0     0 | 664   555 | 294M 23.1M  145M 1541M|3.74 1.13 0.65|1.0   0   0|   0   508M|22-08 15:17:57
Test #8, APC activated, 1 Front, 2Vcpu, 2GB on server ade-esxi-02 (Intel(R) Core(TM) Quad CPU Q6600 @ 2.40GHz; No Hyperthreading; 8 GB DDR2 800) :
$ ab -kc 10 -n 20 http://tu-web-01/mysite/
Requests per second: 5.34 [#/sec] (mean)
This is ApacheBench, Version 2.3
Copyright 1996 Adam Twiss, Zeus Technology Ltd, http://www.zeustech.net/
Licensed to The Apache Software Foundation, http://www.apache.org/
Benchmarking tu-web-01 (be patient).....done
Server Software: Apache/2.2.22
Server Hostname: tu-web-01
Server Port: 80
Document Path: /mysite/
Document Length: 47895 bytes
Concurrency Level: 10
Time taken for tests: 3.745 seconds
Complete requests: 20
Failed requests: 13
(Connect: 0, Receive: 0, Length: 13, Exceptions: 0)
Write errors: 0
Keep-Alive requests: 0
Total transferred: 968921 bytes
HTML transferred: 957901 bytes
Requests per second: 5.34 [#/sec] (mean)
Time per request: 1872.649 [ms] (mean)
Time per request: 187.265 [ms] (mean, across all concurrent requests)
Transfer rate: 252.64 [Kbytes/sec] received
Connection Times (ms)
min mean[+/-sd] median max
Connect: 0 1 0.4 1 2
Processing: 1270 1777 270.6 1823 2252
Waiting: 848 1255 213.3 1200 1652
Total: 1270 1778 270.5 1823 2252
Percentage of the requests served within a certain time (ms)
50% 1823
66% 1946
75% 1958
80% 1963
90% 2230
95% 2252
98% 2252
99% 2252
100% 2252 (longest request)
dstat shows that the CPU hits 100% (0% Idle)
usr sys idl wai hiq siq:usr sys idl wai hiq siq:usr sys idl wai hiq siq| recv  send| read  writ| int   csw | used  buff  cach  free| 1m   5m  15m |run blk new| used  free|     time
 80   7  12   0   0   1: 74  10  16   0   0   0: 78   8  14   0   0   0| 763k  110k|   0    56k|1343  1238 | 389M 22.1M  135M 1457M|1.86 0.47 0.16|9.0   0   0|   0   508M|22-08 15:23:07
 97   2   0   0   0   1: 90  10   0   0   0   0: 93   7   0   0   0   1| 628k  515k|   0    16k|1290   970 | 400M 22.1M  135M 1446M|2.43 0.61 0.21| 10   0   0|   0   508M|22-08 15:23:08
 88  12   0   0   0   0: 91   9   0   0   0   0: 90  10   0   0   0   0| 486k  120k|   0     0 |1383  1090 | 393M 22.1M  135M 1454M|2.43 0.61 0.21|7.0   0   0|   0   508M|22-08 15:23:09
 77   7  15   0   0   1: 77   8  15   0   0   0: 77   8  16   0   0   0| 435k  553k|   0     0 |1071   807 | 323M 22.1M  135M 1524M|2.43 0.61 0.21|  0   0   0|   0   508M|22-08 15:23:10
Test #9, APC activated, 1 Front, 4Vcpu, 2GB on server ade-esxi-02 (Intel(R) Core(TM) Quad CPU Q6600 @ 2.40GHz; No Hyperthreading; 8 GB DDR2 800) :
$ ab -kc 10 -n 20 http://tu-web-01/mysite/
Requests per second: 11.49 [#/sec] (mean)
This is ApacheBench, Version 2.3
Copyright 1996 Adam Twiss, Zeus Technology Ltd, http://www.zeustech.net/
Licensed to The Apache Software Foundation, http://www.apache.org/
Benchmarking tu-web-01 (be patient).....done
Server Software: Apache/2.2.22
Server Hostname: tu-web-01
Server Port: 80
Document Path: /mysite/
Document Length: 47896 bytes
Concurrency Level: 10
Time taken for tests: 1.741 seconds
Complete requests: 20
Failed requests: 19
(Connect: 0, Receive: 0, Length: 19, Exceptions: 0)
Write errors: 0
Keep-Alive requests: 0
Total transferred: 968947 bytes
HTML transferred: 957927 bytes
Requests per second: 11.49 [#/sec] (mean)
Time per request: 870.352 [ms] (mean)
Time per request: 87.035 [ms] (mean, across all concurrent requests)
Transfer rate: 543.59 [Kbytes/sec] received
Connection Times (ms)
min mean[+/-sd] median max
Connect: 0 0 0.4 0 2
Processing: 650 804 134.7 800 1071
Waiting: 428 596 105.3 588 918
Total: 651 804 134.8 801 1073
Percentage of the requests served within a certain time (ms)
50% 801
66% 849
75% 849
80% 929
90% 1061
95% 1073
98% 1073
99% 1073
100% 1073 (longest request)
dstat shows that the CPU hits 100% (0% Idle)
-------cpu0-usage--------------cpu1-usage--------------cpu2-usage--------------cpu3-usage-----------total-cpu-usage---- -net/total- -dsk/total- ---system-- ------memory-usage----- ---load-avg--- ---procs--->
usr sys idl wai hiq siq:usr sys idl wai hiq siq:usr sys idl wai hiq siq:usr sys idl wai hiq siq:usr sys idl wai hiq siq| recv  send| read  writ| int   csw | used  buff  cach  free| 1m   5m  15m |run blk new>
 18   0  82   0   0   0: 17   1  82   0   0   0: 14   2  84   0   0   0: 16   2  82   0   0   0: 17   2  82   0   0   0| 511k   28k|   0     0 | 617   677 | 303M 22.1M  134M 1544M|0.26 0.06 0.02|9.0   0   0>
 90   9   0   0   0   1: 89  10   1   0   0   0: 89   9   1   0   0   1: 89   9   2   0   0   0: 89   9   1   0   0   1|1225k  670k|   0     0 |1996  1826 | 336M 22.1M  134M 1511M|0.26 0.06 0.02|8.0   0 1.0>
 46   5  48   0   0   1: 47   3  50   0   0   0: 45   2  53   0   0   0: 43   6  50   1   0   0: 45   4  50   0   0   0| 573k  585k|   0  2048B|1039   817 | 290M 22.1M  134M 1557M|0.26 0.06 0.02|  0   0   0>
Conclusion in using APC
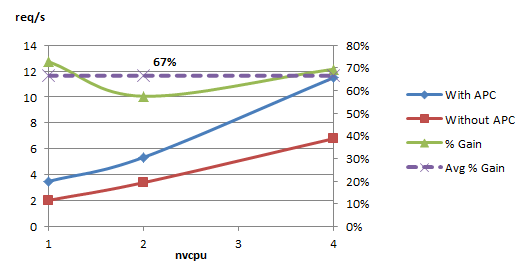
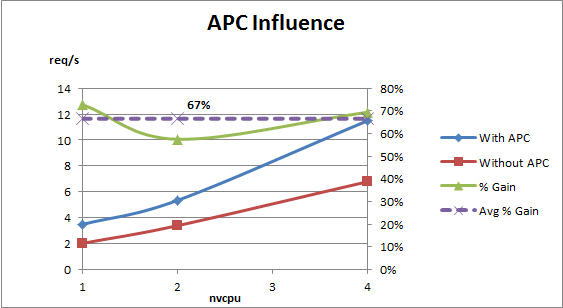
For this simple workload (accessing the Home page of a wordpress blog that contains 5 middle sized post), the following graph shows how the performance is related to APC as the CPU increases.

APC Influence on req/sec
This graph shows an average increase of performance of 67% with APC.
I decided to use APC for the following tests.
go to Introduction


