Results overview
Raw throughput of a WordPress web site and influence of cpu and memory on the front
In order to evaluate the expected performance of a WordPress web site, I first decided to focus on a single front and to play with the CPU and MEMORY resources of the front.
To be sure that no other bottlenecks appear (such as the database server resources -CPU, MEMORY, IO – or the network resources), I was continually checking the performance counters on the database server and on the front server with commands such as iostat, vmstat, top and iftop for the network during the workload. After a while, I found the perfect command dstat that shows all counters for CPU, IO and MEMORY from just one command line.
To quickly evaluate the speed (throughput) of the web site, I decided to use the apache tool ab that gives a very useful indicator in req/s.
Evaluate the influence of the CPU and the memory on the front
For this series of tests, I use a mysql server VM with 2GB and 2vcpu to avoid any contention on the database such as the resources used on the mysql server are very limited for this kind of test (simulating simultaneous access of the home page of the WordPress web site with a very few number of posts).
The important parameters for the sql server are :
innodb_buffer_pool_size=1G

query_cache_limit = 4M

query_cache_size = 512M
The mysql server VM runs on ade-esxi-01: Intel(R) Core(TM) Quad CPU Q6600 @ 2.40GHz; No Hyperthreading; 8 GB DDR2 800; Raid card 3ware 9650SE+BBU; 4x1TB RAID10; WD Caviar Black 7200t/min (WD1001FALS)
I runs the ab command from a separate server (AMD bicore). Each result is the best one from a series of 3 tests.
I used the parameter -k to use HTTP KeepAlive feature.
Influence of the memory increase on the front.
For the three first tests, I kept a constant CPU resource and I changed only the RAM
Test #1, 1 Front, 1Vcpu, 512 MB on server ade-esxi-02 (Intel(R) Core(TM) Quad CPU Q6600 @ 2.40GHz; No Hyperthreading; 8 GB DDR2 800) :
$ ab -kc 10 -n 20 http://tu-web-01/mysite/
Requests per second: 0.72 [#/sec] (mean)
This is ApacheBench, Version 2.3
Copyright 1996 Adam Twiss, Zeus Technology Ltd, http://www.zeustech.net/
Licensed to The Apache Software Foundation, http://www.apache.org/
Benchmarking tu-web-01 (be patient).....done
Server Software: Apache/2.2.22
Server Hostname: tu-web-01
Server Port: 80
Document Path: /mysite/
Document Length: 47952 bytes
Concurrency Level: 10
Time taken for tests: 27.818 seconds
Complete requests: 20
Failed requests: 15
(Connect: 0, Receive: 0, Length: 15, Exceptions: 0)
Write errors: 0
Keep-Alive requests: 0
Total transferred: 970129 bytes
HTML transferred: 959089 bytes
Requests per second: 0.72 [#/sec] (mean)
Time per request: 13908.755 [ms] (mean)
Time per request: 1390.875 [ms] (mean, across all concurrent requests)
Transfer rate: 34.06 [Kbytes/sec] received
Connection Times (ms)
min mean[+/-sd] median max
Connect: 0 1 0.5 0 2
Processing: 7773 13338 4666.8 14037 19450
Waiting: 6134 10581 3690.0 11942 15617
Total: 7774 13339 4667.1 14038 19452
ERROR: The median and mean for the initial connection time are more than twice the standard
deviation apart. These results are NOT reliable.
Percentage of the requests served within a certain time (ms)
50% 14038
66% 17945
75% 18047
80% 18072
90% 18946
95% 19452
98% 19452
99% 19452
100% 19452 (longest request)
The cpu on the front was at 100% (idle 0%) as the following iostat result shows it
avg-cpu:  %user   %nice %system %iowait  %steal   %idle
          82.09    0.00   17.91    0.00    0.00    0.00
avg-cpu:  %user   %nice %system %iowait  %steal   %idle
          44.21    0.00   29.47   26.32    0.00    0.00
avg-cpu:  %user   %nice %system %iowait  %steal   %idle
          46.91    0.00   29.38   23.71    0.00    0.00
avg-cpu:  %user   %nice %system %iowait  %steal   %idle
          50.00    0.00   26.29   23.71    0.00    0.00
Test #2, 1 Front, 1Vcpu, 1 GB on server ade-esxi-02 (Intel(R) Core(TM) Quad CPU Q6600 @ 2.40GHz; No Hyperthreading; 8 GB DDR2 800) :
$ ab -kc 10 -n 20 http://tu-web-01/mysite/
Requests per second: 1.90 [#/sec] (mean)
This is ApacheBench, Version 2.3
Copyright 1996 Adam Twiss, Zeus Technology Ltd, http://www.zeustech.net/
Licensed to The Apache Software Foundation, http://www.apache.org/
Benchmarking tu-web-01 (be patient).....done
Server Software: Apache/2.2.22
Server Hostname: tu-web-01
Server Port: 80
Document Path: /mysite/
Document Length: 47955 bytes
Concurrency Level: 10
Time taken for tests: 10.528 seconds
Complete requests: 20
Failed requests: 17
(Connect: 0, Receive: 0, Length: 17, Exceptions: 0)
Write errors: 0
Keep-Alive requests: 0
Total transferred: 970128 bytes
HTML transferred: 959088 bytes
Requests per second: 1.90 [#/sec] (mean)
Time per request: 5263.991 [ms] (mean)
Time per request: 526.399 [ms] (mean, across all concurrent requests)
Transfer rate: 89.99 [Kbytes/sec] received
Connection Times (ms)
min mean[+/-sd] median max
Connect: 0 1 0.7 1 3
Processing: 4820 5189 167.3 5250 5362
Waiting: 3576 4037 233.9 4017 4307
Total: 4823 5190 166.8 5251 5363
Percentage of the requests served within a certain time (ms)
50% 5251
66% 5303
75% 5309
80% 5319
90% 5320
95% 5363
98% 5363
99% 5363
100% 5363 (longest request)
The cpu on the front was at 100% (idle 0%) as the following iostat result shows it
avg-cpu:  %user   %nice %system %iowait  %steal   %idle
          81.59    0.00   18.41    0.00    0.00    0.00

avg-cpu:  %user   %nice %system %iowait  %steal   %idle
          82.50    0.00   17.50    0.00    0.00    0.00

avg-cpu:  %user   %nice %system %iowait  %steal   %idle
          72.86    0.00   27.14    0.00    0.00    0.00

avg-cpu:  %user   %nice %system %iowait  %steal   %idle
          87.56    0.00   12.44    0.00    0.00    0.00
No swap was used
$ free -m
             total       used       free     shared    buffers     cached
Mem:           995        412        582          0         22        112
-/+ buffers/cache:        277        717
Swap:          507          0        507
Test #3, 1 Front, 1Vcpu, 2 GB on server ade-esxi-02 (Intel(R) Core(TM) Quad CPU Q6600 @ 2.40GHz; No Hyperthreading; 8 GB DDR2 800) :
$ ab -kc 10 -n 20 http://tu-web-01/mysite/
Requests per second: 2.01 [#/sec] (mean)
This is ApacheBench, Version 2.3
Copyright 1996 Adam Twiss, Zeus Technology Ltd, http://www.zeustech.net/
Licensed to The Apache Software Foundation, http://www.apache.org/
Benchmarking tu-web-01 (be patient).....done
Server Software: Apache/2.2.22
Server Hostname: tu-web-01
Server Port: 80
Document Path: /mysite/
Document Length: 47953 bytes
Concurrency Level: 10
Time taken for tests: 9.959 seconds
Complete requests: 20
Failed requests: 16
(Connect: 0, Receive: 0, Length: 16, Exceptions: 0)
Write errors: 0
Keep-Alive requests: 0
Total transferred: 970113 bytes
HTML transferred: 959073 bytes
Requests per second: 2.01 [#/sec] (mean)
Time per request: 4979.567 [ms] (mean)
Time per request: 497.957 [ms] (mean, across all concurrent requests)
Transfer rate: 95.13 [Kbytes/sec] received
Connection Times (ms)
min mean[+/-sd] median max
Connect: 0 1 1.3 1 4
Processing: 4808 4974 136.0 5055 5139
Waiting: 3620 3751 112.5 3803 3903
Total: 4812 4975 135.7 5056 5140
Percentage of the requests served within a certain time (ms)
50% 5056
66% 5100
75% 5120
80% 5124
90% 5140
95% 5140
98% 5140
99% 5140
100% 5140 (longest request)
The cpu on the front was at 100% (idle 0%) as the following iostat result shows it
avg-cpu:  %user   %nice %system %iowait  %steal   %idle
          82.91    0.00   17.09    0.00    0.00    0.00

avg-cpu:  %user   %nice %system %iowait  %steal   %idle
          92.54    0.00    7.46    0.00    0.00    0.00

avg-cpu:  %user   %nice %system %iowait  %steal   %idle
          87.00    0.00   13.00    0.00    0.00    0.00

avg-cpu:  %user   %nice %system %iowait  %steal   %idle
          78.89    0.00   21.11    0.00    0.00    0.00
No swap was used and we had approx 1,6G free memory
tprojadmin@tu-web-01:~$ free -m
             total       used       free     shared    buffers     cached
Mem:          2003        431       1572          0         22        112
-/+ buffers/cache:        296       1707
Swap:          507          0        507
During the 3 tests, the cpu usage on the mysql server was very low (approx 1%) and no iops occured on the disk as the test only generated read access and the database fitted in memory.
The following iostat results (during the workload) on the mysql server demonstrates it
avg-cpu:  %user   %nice %system %iowait  %steal   %idle
           0.00    0.00    0.25    0.00    0.00   99.75

Device:            tps    kB_read/s    kB_wrtn/s    kB_read    kB_wrtn
sda               1.00         0.00        16.00          0         32
dm-0              4.00         0.00        16.00          0         32
dm-1              0.00         0.00         0.00          0          0

avg-cpu:  %user   %nice %system %iowait  %steal   %idle
           0.25    0.00    0.00    0.00    0.00   99.75

Device:            tps    kB_read/s    kB_wrtn/s    kB_read    kB_wrtn
sda               0.00         0.00         0.00          0          0
dm-0              0.00         0.00         0.00          0          0
dm-1              0.00         0.00         0.00          0          0

avg-cpu:  %user   %nice %system %iowait  %steal   %idle
           0.00    0.00    0.25    0.00    0.00   99.75

Device:            tps    kB_read/s    kB_wrtn/s    kB_read    kB_wrtn
sda               0.00         0.00         0.00          0          0
dm-0              0.00         0.00         0.00          0          0
dm-1              0.00         0.00         0.00          0          0
Influence of the cpu increase on the front.
For the following three tests, I kept a constant RAM resource and I changed only the CPU
Rem:
To increase the CPU, I changed the number of cores per socket in VMware 5 (I kept the Number of virtual sockets to 1)
Test #4, 1 Front, 1Vcpu, 2GB on server ade-esxi-02 (Intel(R) Core(TM) Quad CPU Q6600 @ 2.40GHz; No Hyperthreading; 8 GB DDR2 800) :
$ ab -kc 10 -n 20 http://tu-web-01/mysite/
Requests per second: 2.02 [#/sec] (mean)
This is ApacheBench, Version 2.3
Copyright 1996 Adam Twiss, Zeus Technology Ltd, http://www.zeustech.net/
Licensed to The Apache Software Foundation, http://www.apache.org/
Benchmarking tu-web-01 (be patient).....done
Server Software: Apache/2.2.22
Server Hostname: tu-web-01
Server Port: 80
Document Path: /mysite/
Document Length: 47897 bytes
Concurrency Level: 10
Time taken for tests: 9.904 seconds
Complete requests: 20
Failed requests: 16
(Connect: 0, Receive: 0, Length: 16, Exceptions: 0)
Write errors: 0
Keep-Alive requests: 0
Total transferred: 968936 bytes
HTML transferred: 957916 bytes
Requests per second: 2.02 [#/sec] (mean)
Time per request: 4952.181 [ms] (mean)
Time per request: 495.218 [ms] (mean, across all concurrent requests)
Transfer rate: 95.54 [Kbytes/sec] received
Connection Times (ms)
min mean[+/-sd] median max
Connect: 0 1 1.3 1 4
Processing: 4704 4879 105.5 4874 5078
Waiting: 3490 3733 229.5 3678 4267
Total: 4705 4880 104.9 4875 5080
Percentage of the requests served within a certain time (ms)
50% 4875
66% 4919
75% 4959
80% 4983
90% 5046
95% 5080
98% 5080
99% 5080
100% 5080 (longest request)
dstat shows a 100% CPU usage and 1170M Free memory (no swap)
-------cpu0-usage-----------total-cpu-usage---- -net/total- -dsk/total- ---system-- ------memory-usage----- ---load-avg--- ---procs--- ----system---- ----swap---
usr sys idl wai hiq siq:usr sys idl wai hiq siq| recv  send| read  writ| int   csw | used  buff  cach  free| 1m   5m  15m |run blk new|     time     | used  free
 22   3  75   0   0   0: 22   3  75   0   0   0| 497k   13k|   0     0 | 254   182 | 296M 22.8M  112M 1572M|0.32 0.76 0.44| 10   0 1.0|21-08 17:23:51|   0   508M
 81  19   0   0   0   0: 81  19   0   0   0   0|  14k   14k|   0     0 | 341   408 | 351M 22.8M  112M 1518M|0.32 0.76 0.44| 10   0 2.0|21-08 17:23:52|   0   508M
 71  28   0   0   0   1: 71  28   0   0   0   1|2092B 7023B|   0   108k| 320   334 | 481M 22.8M  112M 1387M|1.09 0.91 0.50| 13   0 4.0|21-08 17:23:53|   0   508M
 91   9   0   0   0   0: 91   9   0   0   0   0|  90k   69k|   0     0 | 471   719 | 547M 22.8M  112M 1321M|1.09 0.91 0.50| 10   0   0|21-08 17:23:54|   0   508M
 98   2   0   0   0   0: 98   2   0   0   0   0| 375k  380k|   0     0 | 577   426 | 561M 22.8M  112M 1307M|1.09 0.91 0.50| 10   0   0|21-08 17:23:55|   0   508M
 72  28   0   0   0   0: 72  28   0   0   0   0| 336k  179k|   0     0 | 481   514 | 331M 22.8M  113M 1537M|1.09 0.91 0.50| 10   0   0|21-08 17:23:56|   0   508M
 73  27   0   0   0   0: 73  27   0   0   0   0| 352k   15k|   0     0 | 450   456 | 428M 22.8M  113M 1440M|1.09 0.91 0.50| 10   0   0|21-08 17:23:57|   0   508M
 72  28   0   0   0   0: 72  28   0   0   0   0|  11k   11k|   0    20k| 341   379 | 540M 22.8M  113M 1328M|1.81 1.06 0.55| 10   0   0|21-08 17:23:58|   0   508M
 81  19   0   0   0   0: 81  19   0   0   0   0|  16k   11k|   0     0 | 378   357 | 649M 22.8M  113M 1220M|1.81 1.06 0.55| 10   0   0|21-08 17:23:59|   0   508M
 90  10   0   0   0   0: 90  10   0   0   0   0| 371k  141k|   0     0 | 874   799 | 698M 22.8M  113M 1170M|1.81 1.06 0.55| 10   0   0|21-08 17:24:00|   0   508M
 93   7   0   0   0   0: 93   7   0   0   0   0| 256k  406k|   0     0 | 549   449 | 626M 22.8M  113M 1242M|1.81 1.06 0.55|8.0 1.0   0|21-08 17:24:01|   0   508M
 23  13  64   0   0   0: 23  13  64   0   0   0|8264B   68k|   0     0 | 151   207 | 444M 22.8M  113M 1424M|1.81 1.06 0.55|  0   0   0|21-08 17:24:02|   0   508M
Test #5, 1 Front, 2Vcpu, 2GB on server ade-esxi-02 (Intel(R) Core(TM) Quad CPU Q6600 @ 2.40GHz; No Hyperthreading; 8 GB DDR2 800) :
$ ab -kc 10 -n 20 http://tu-web-01/mysite/
Requests per second: 3.39 [#/sec] (mean)
This is ApacheBench, Version 2.3
Copyright 1996 Adam Twiss, Zeus Technology Ltd, http://www.zeustech.net/
Licensed to The Apache Software Foundation, http://www.apache.org/
Benchmarking tu-web-01 (be patient).....done
Server Software: Apache/2.2.22
Server Hostname: tu-web-01
Server Port: 80
Document Path: /mysite/
Document Length: 47895 bytes
Concurrency Level: 10
Time taken for tests: 5.907 seconds
Complete requests: 20
Failed requests: 17
(Connect: 0, Receive: 0, Length: 17, Exceptions: 0)
Write errors: 0
Keep-Alive requests: 0
Total transferred: 968943 bytes
HTML transferred: 957923 bytes
Requests per second: 3.39 [#/sec] (mean)
Time per request: 2953.416 [ms] (mean)
Time per request: 295.342 [ms] (mean, across all concurrent requests)
Transfer rate: 160.19 [Kbytes/sec] received
Connection Times (ms)
min mean[+/-sd] median max
Connect: 0 1 0.6 0 3
Processing: 2451 2878 228.6 2933 3202
Waiting: 1789 2189 198.7 2196 2584
Total: 2451 2879 228.4 2933 3202
WARNING: The median and mean for the initial connection time are not within a normal deviation
These results are probably not that reliable.
Percentage of the requests served within a certain time (ms)
50% 2933
66% 3024
75% 3048
80% 3108
90% 3188
95% 3202
98% 3202
99% 3202
100% 3202 (longest request)
dstat shows a 100% CPU usage and 1232M Free memory (no swap)
-------cpu0-usage--------------cpu1-usage-----------total-cpu-usage---- -net/total- -dsk/total- ---system-- ------memory-usage----- ---load-avg--- ---procs--- ----system---- ----swap---
usr sys idl wai hiq siq:usr sys idl wai hiq siq:usr sys idl wai hiq siq| recv  send| read  writ| int   csw | used  buff  cach  free| 1m   5m  15m |run blk new|     time     | used  free
 62   7  31   0   0   0: 61  10  29   0   0   0: 61   9  30   0   0   0| 509k   23k|   0    16k| 651   584 | 419M 22.4M  114M 1448M|2.03 1.04 0.45| 10   0   0|21-08 17:35:12|   0   508M
 77  23   0   0   0   0: 79  21   0   0   0   0: 78  22   0   0   0   0|  64k   39k|   0     0 | 859   768 | 601M 22.4M  114M 1267M|2.03 1.04 0.45| 10   0 1.0|21-08 17:35:13|   0   508M
 94   6   0   0   0   0: 89  11   0   0   0   0: 92   8   0   0   0   0| 527k  471k|   0     0 |1266   980 | 580M 22.4M  114M 1287M|2.03 1.04 0.45| 10   0 2.0|21-08 17:35:14|   0   508M
 75  24   0   0   0   1: 83  17   0   0   0   0: 79  21   0   0   0   0| 565k  133k|   0     0 | 912   749 | 462M 22.4M  114M 1406M|2.03 1.04 0.45| 10   0   0|21-08 17:35:15|   0   508M
 83  16   0   0   0   1: 82  18   0   0   0   0: 82  17   0   0   0   1| 113k   45k|   0     0 | 954   808 | 636M 22.4M  114M 1232M|2.59 1.17 0.50| 10   0   0|21-08 17:35:16|   0   508M
 90   8   0   0   0   2: 91   9   0   0   0   0: 91   9   0   0   0   1| 481k  483k|   0     0 |1283   977 | 592M 22.4M  114M 1276M|2.59 1.17 0.50|6.0   0   0|21-08 17:35:17|   0   508M
 23   4  73   0   0   0: 19  10  71   0   0   0: 21   7  72   0   0   0|  58k  100k|   0    16k| 287   215 | 391M 22.4M  114M 1476M|2.59 1.17 0.50|  0   0   0|21-08 17:35:18|   0   508M
Test #6, 1 Front, 4Vcpu, 2GB on server ade-esxi-02 (Intel(R) Core(TM) Quad CPU Q6600 @ 2.40GHz; No Hyperthreading; 8 GB DDR2 800) :
$ ab -kc 10 -n 20 http://tu-web-01/mysite/
Requests per second: 6.78 [#/sec] (mean)
This is ApacheBench, Version 2.3
Copyright 1996 Adam Twiss, Zeus Technology Ltd, http://www.zeustech.net/
Licensed to The Apache Software Foundation, http://www.apache.org/
Benchmarking tu-web-01 (be patient).....done
Server Software: Apache/2.2.22
Server Hostname: tu-web-01
Server Port: 80
Document Path: /mysite/
Document Length: 47898 bytes
Concurrency Level: 10
Time taken for tests: 2.950 seconds
Complete requests: 20
Failed requests: 12
(Connect: 0, Receive: 0, Length: 12, Exceptions: 0)
Write errors: 0
Keep-Alive requests: 0
Total transferred: 968943 bytes
HTML transferred: 957923 bytes
Requests per second: 6.78 [#/sec] (mean)
Time per request: 1474.962 [ms] (mean)
Time per request: 147.496 [ms] (mean, across all concurrent requests)
Transfer rate: 320.77 [Kbytes/sec] received
Connection Times (ms)
min mean[+/-sd] median max
Connect: 0 0 0.4 0 2
Processing: 1170 1399 144.6 1422 1646
Waiting: 899 1070 111.8 1079 1304
Total: 1170 1400 144.6 1422 1646
Percentage of the requests served within a certain time (ms)
50% 1422
66% 1452
75% 1506
80% 1564
90% 1629
95% 1646
98% 1646
99% 1646
100% 1646 (longest request)
dstat shows a 100% CPU usage and 1030M Free memory (no swap)
-------cpu0-usage--------------cpu1-usage--------------cpu2-usage--------------cpu3-usage-----------total-cpu-usage---- -net/total- -dsk/total- ---system-- ------memory-usage----- ---load-avg--- ---procs--- ----swap--->
usr sys idl wai hiq siq:usr sys idl wai hiq siq:usr sys idl wai hiq siq:usr sys idl wai hiq siq:usr sys idl wai hiq siq| recv  send| read  writ| int   csw | used  buff  cach  free| 1m   5m  15m |run blk new| used  free>
 15   2  83   0   0   0:  1   3  96   0   0   0:  9   0  91   0   0   0:  7   5  88   0   0   0:  8   3  89   0   0   0|  49k  105k|   0    20k| 306   180 | 414M 22.6M  121M 1446M|1.39 0.71 0.32|  0   0   0|   0   508M>
 25   2  73   0   0   0: 16   5  79   0   0   0: 17   5  78   0   0   0: 24   3  73   0   0   0: 20   4  76   0   0   0| 499k   15k|   0     0 | 515   303 | 403M 22.6M  121M 1457M|2.08 0.86 0.37| 10   0   0|   0   508M>
 84  14   0   0   0   2: 87  13   0   0   0   0: 85  15   0   0   0   0: 87  13   0   0   0   0: 86  14   0   0   0   1| 598k  470k|   0     0 |2110  1340 | 603M 22.6M  121M 1257M|2.08 0.86 0.37|9.0   0 1.0|   0   508M>
 81  18   0   0   0   1: 84  16   0   0   0   0: 75  25   0   0   0   0: 82  18   0   0   0   0: 80  19   0   0   0   0| 658k  254k|   0     0 |1755  1098 | 638M 22.6M  121M 1222M|2.08 0.86 0.37| 10   0   0|   0   508M>
 61   4  34   0   0   1: 59   6  35   0   0   0: 54   8  38   0   0   0: 52   9  39   0   0   0: 57   7  36   0   0   0| 559k  546k|   0     0 |1357   905 | 417M 22.6M  121M 1443M|2.08 0.86 0.37|  0   0   0|   0   508M>
On the mysql server,
dstat shows a very limited cpu usage (approx 1%)
Conclusion on cpu increase and ram increase
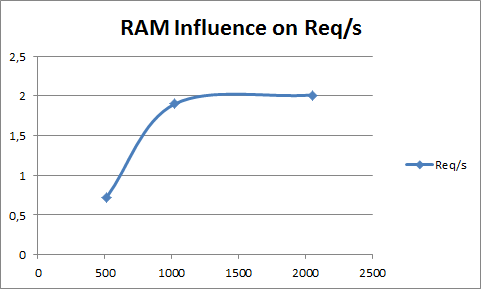
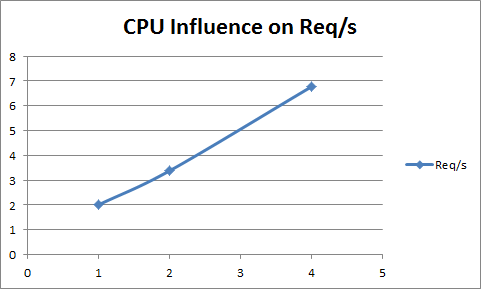
For this simple workload (accessing the Home page of a wordpress blog that contains 5 middle sized post), the 2 following graphs show how the performance is related to the CPU and RAM increase.

RAM Influence on req/sec

CPU Influence on req/sec
We clearly see that as the front server has enough memory to not swap, the predominant parameter is the CPU.
So we could expect a big increase of performance by adding more fronts (linear? we will see it soon)
As an apache process (that embeds the php executable) in the prefork model and mod_php consumes approx 30M-50M, and the free RAM is approx 1600M (roughly 400M is consumed by the system and the different system’s processes), we can presume that we could hit the max memory with 30-50 concurrent requests.
Let’s have a try:
ab -kc 45 -n 200 http://tu-web-01/mysite/
gives (dstat result)
usr sys idl wai hiq siq:usr sys idl wai hiq siq:usr sys idl wai hiq siq:usr sys idl wai hiq siq:usr sys idl wai hiq siq| recv  send| read  writ| int   csw | used  buff  cach  free| 1m   5m  15m |run blk new| used  free>
 63  27   0   6   0   4: 70  22   0   7   0   1: 61  29   0   8   0   2: 73  19   0   6   0   2: 66  24   0   7   0   3|  64k   51k|3984k   27M|  12k 1976 |1935M  872k 13.0M 54.4M|26.2 22.3 10.9| 24  26 4.0|  69M  439M>
 51  11   0  32   0   6: 42  13   4  41   0   1: 31  20   0  45   0   4: 36  20   0  42   0   2: 40  16   1  40   0   3| 343k  101k|  11M   57M|7581  3041 |1937M  872k 11.5M 53.8M|26.2 22.3 10.9| 12  38 8.0| 123M  385M>
 62   9   0  21   0   8: 49  12   0  35   0   4: 55   7   0  34   0   3: 46   8   0  42   0   3: 53   9   0  33   0   5| 426k  310k|  15M   48M|5869  2947 |1937M  872k 11.8M 53.8M|26.2 22.3 10.9| 47  41   0| 165M  343M>
 57  15   0  22   0   6: 31  11   0  57   0   1: 53   7   0  38   0   2: 22  11   0  65   0   2: 40  11   0  46   0   3| 469k  275k|  13M 7452k|3800  2095 |1901M  872k 14.2M 87.1M|28.0 22.7 11.1|5.0  44   0| 178M  330M>
 63  15   0  19   0   3: 63  11   0  26   0   0: 57  13   0  29   0   1: 62   8   0  28   0   2: 61  12   0  25   0   2| 434k  421k|  19M   20M|4878  2672 |1867M  872k 15.0M  121M|28.0 22.7 11.1| 13  37   0| 191M  317M>
So we are just above the limit of the memory : 53M free RAM and approx 200M of swap consumed
go to Introduction


