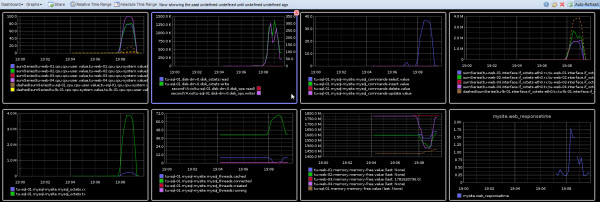
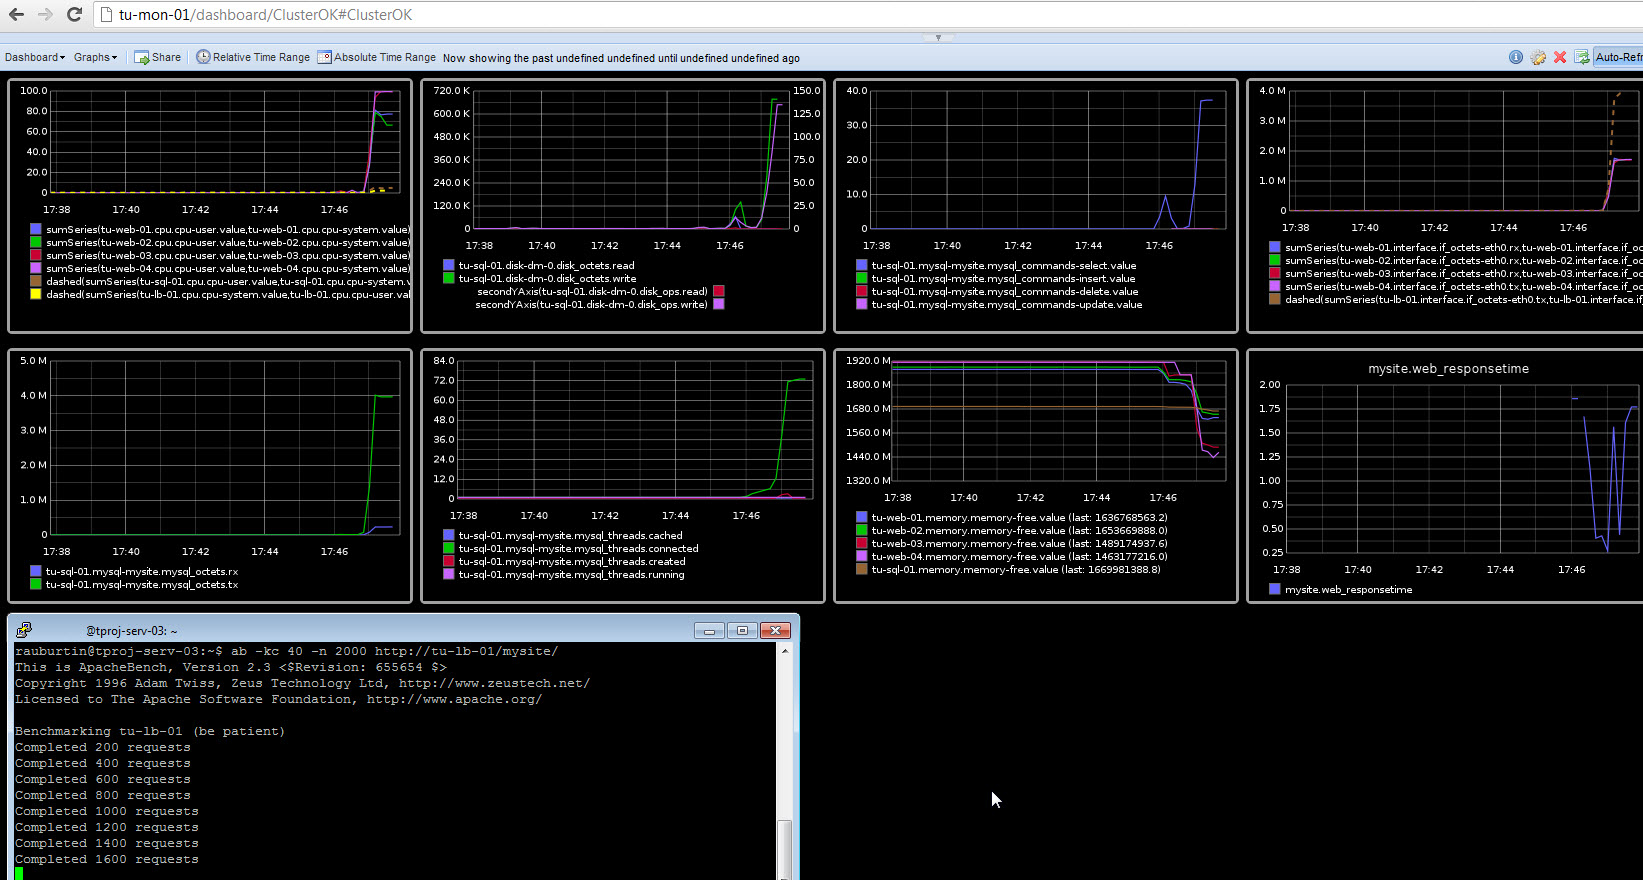
The dashboard above shows what you can do with graphite
At one glance, you have all the indicators you need in real time (I have an auto refresh every 10sec)
In this post, I will show you how to get it by installing and configuring collectd, graphite.
Then we will write a custom performance collector in python to check the response time.
Graphite is a wonderful tool to store and display all kind of time series measures.
By default, Graphite is able to graph mesures stored in rddtool files (round robin database) or in its whisper database (see the graphite architecture).
With graphite, it is very easy to develop you own collector but as compatible existing tools such as collectd exist (tools that can use rddtool database to store the values or that can send the values to graphite via the carbon component of Graphite), I decided to use collectd.
Installing and configuring collectd
I just followed the instructions http://collectd.org/wiki/index.php/First_steps
I created an ubuntu 12.04 x64 server fresh VM and named the server : tu-mon-01.
Collectd Basic Configuration
Then I used the following instructions:
sudo apt-get install collectd
#the following commands are needed to install the web app (collection3) that can display the time series stored in the rddtool files
sudo apt-get install apache2

sudo apt-get install librrds-perl libconfig-general-perl libhtml-parser-perl  libregexp-common-perl
cd /usr/share/doc/collectd/examples
sudo cp -r collection3 /var/www
sudo chown -R www-data:www-data collection3/

sudo vi /etc/apache2/sites-available/default
	#AllowOverride None
        AllowOverride All
sudo /etc/init.d/apache2 restart
collectd is made up of a set of plugins (to collect or store performance counters) that you can activate as you want. The default installation comes with a ready-to-use set of plugins.
As I installed the collection3 webapp, I could see right away some graphs by accessing the webpage http://tu-mon-01/collection3/bin/index.cgi on my tu-mon-01 server. This tool is basic but does the job.
Rem:
I tested other tools such as drraw and visage but as I planed to use Graphite, I didn’t take a lot of time to evaluate them.
I liked visage, simple and excellent graphic capabilities.
Collectd Cient Server Configuration
Then I setup the client-server collectd configuration because I just wanted to collect values on the 4 fronts, the mysql servers and the load balancers and to store the values on the monitoring server tu-mon-01 (IP 192.168.100.211)
on tu-web-01, tu-web-02, tu-web-03, tu-web-04, tu-sql-01, tu-lb-01 :
$ sudo apt-get install collectd
$ sudo vi /etc/collectd/collectd.conf
LoadPlugin network
#LoadPlugin rrdtool
<Plugin network>
    # client setup:
    Server "192.168.100.211"
</Plugin>
$ sudo /etc/init.d/collectd restart
on tu-mon-01 :
$ sudo vi /etc/collectd/collectd.conf
LoadPlugin network
<Plugin network>
         Listen "192.168.100.211"
</Plugin>
$ sudo /etc/init.d/collectd restart
Cpu Usage Aggregation
One thing that I find very annoying with collectd is that the standard cpu plugin does not sum the % usage of each core.
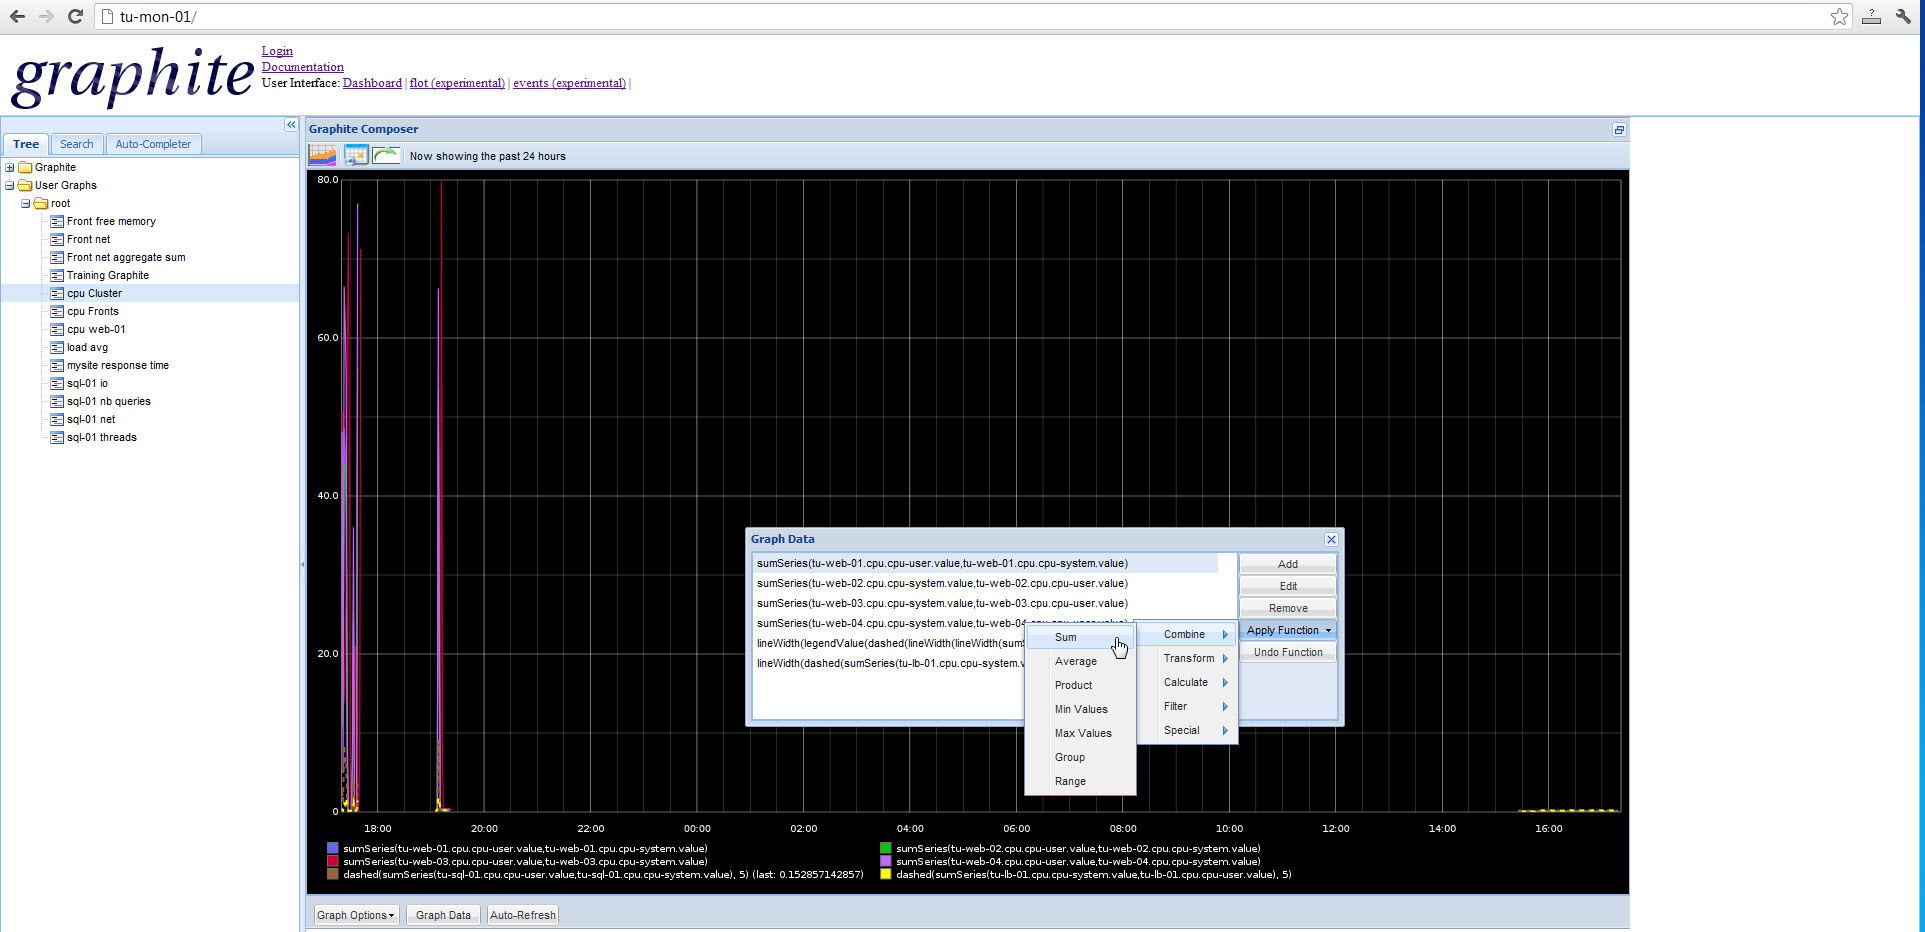
Even if you can sum with graphite (I will show it to sum the system and the user percentage usage), I prefer to get the total percentage in the stored values.
There is a plugin aggregation here but it is still in development and I didn’t find any source.
After some google searchs, I found a patch here that does the job. So I followed the instructions to build the debian package and installed the new package on all the servers
To build the package on tu_mon-01:
mkdir collectd
cd collectd
sudo apt-get install devscripts build-essential fakeroot
sudo apt-get source collectd
sudo apt-get build-dep collectd
wget http://www.varnernet.com/~bryan/wp-content/uploads/cpuagg.patch_.tar.gz
tar -xzf cpuagg.patch_.tar.gz
cd collectd-4.10.1
patch -p0 < ../cpuagg.patch
debuild -us -uc
cd ..
sudo dpkg -i collectd-core_4.10.1-2.1ubuntu7_amd64.deb
To install the package on tu-web-01
scp tu-mon-01:~/collectd/collectd-core_4.10.1-2.1ubuntu7_amd64.deb .
sudo dpkg -i collectd-core_4.10.1-2.1ubuntu7_amd64.deb
Mysql plugin
On the mysql server, I activated the plugin as followed:
$ sudo vi /etc/collectd/collectd.conf
LoadPlugin mysql
<Plugin mysql>
  <Database mysite>
    Host "localhost"
    Port 3306
    User "root"
    Password "[PASSWORD]"
    Database "mysite"
    MasterStats true
  </Database>
</Plugin>
Installing and configuring Graphite
I found a very good presentation here http://www.aosabook.org/en/graphite.html and nice installation instructions here http://geek.michaelgrace.org/2011/09/how-to-install-graphite-on-ubuntu/
Installing Graphite
I just adapted a little the instructions to download the last Graphite version.
mkdir graphite
cd graphite/
wget https://launchpad.net/graphite/0.9/0.9.10/+download/graphite-web-0.9.10.tar.gz
wget https://launchpad.net/graphite/0.9/0.9.10/+download/carbon-0.9.10.tar.gz
wget https://launchpad.net/graphite/0.9/0.9.10/+download/whisper-0.9.10.tar.gz
tar -xvf graphite-web-0.9.10.tar.gz
tar -xvf carbon-0.9.10.tar.gz
tar -xvf whisper-0.9.10.tar.gz
mv graphite-web-0.9.10 graphite
mv carbon-0.9.10 carbon
mv whisper-0.9.10 whisper
rm graphite-web-0.9.10.tar.gz
rm carbon-0.9.10.tar.gz
rm whisper-0.9.10.tar.gz
sudo apt-get install --assume-yes apache2 apache2-mpm-worker apache2-utils apache2.2-bin apache2.2-common libapr1 libaprutil1 libaprutil1-dbd-sqlite3 python3.2 libpython3.2 python3.2-minimal libapache2-mod-wsgi libaprutil1-ldap memcached python-cairo-dev python-django python-ldap python-memcache python-pysqlite2 sqlite3 erlang-os-mon erlang-snmp rabbitmq-server bzr expect ssh libapache2-mod-python python-setuptools
sudo easy_install django-tagging
cd whisper/
sudo python setup.py install
cd ../carbon/
sudo python setup.py install
cd /opt/graphite/conf/
sudo cp carbon.conf.example carbon.conf
sudo cp storage-schemas.conf.example storage-schemas.conf
sudo vi storage-schemas.conf
cd
cd graphite/graphite/
sudo python check-dependencies.py
sudo python setup.py install
sudo cp /etc/apache2/sites-available/default /etc/apache2/sites-available/default.orig
cd examples/
sudo cp example-graphite-vhost.conf /etc/apache2/sites-available/default
sudo cp /opt/graphite/conf/graphite.wsgi.example /opt/graphite/conf/graphite.wsgi
sudo vim /etc/apache2/sites-available/default
  WSGISocketPrefix run/wsgi
  <VirtualHost *:80>
    ServerName graphite
    DocumentRoot "/opt/graphite/webapp"
    ErrorLog /opt/graphite/storage/log/webapp/error.log
    CustomLog /opt/graphite/storage/log/webapp/access.log common
    # I've found that an equal number of processes & threads tends
    # to show the best performance for Graphite (ymmv).
    WSGIDaemonProcess graphite processes=5 threads=5 display-name='%{GROUP}' inactivity-timeout=120
    WSGIProcessGroup graphite
    WSGIApplicationGroup %{GLOBAL}
    WSGIImportScript /opt/graphite/conf/graphite.wsgi process-group=graphite application-group=%{GLOBAL}
    # XXX You will need to create this file! There is a graphite.wsgi.example
    # file in this directory that you can safely use, just copy it to graphite.wgsi
    WSGIScriptAlias / /opt/graphite/conf/graphite.wsgi
    Alias /content/ /opt/graphite/webapp/content/
    <Location "/content/">
      SetHandler None
    </Location>
    # XXX In order for the django admin site media to work you
    # must change @DJANGO_ROOT@ to be the path to your django
    # installation, which is probably something like:
    # /usr/lib/python2.6/site-packages/django
    Alias /media/ "@DJANGO_ROOT@/contrib/admin/media/"
    <Location "/media/">
      SetHandler None
    </Location>
    # The graphite.wsgi file has to be accessible by apache. It won't
    # be visible to clients because of the DocumentRoot though.
    <Directory /opt/graphite/conf/>
      Order deny,allow
      Allow from all
    </Directory>
  </VirtualHost>
sudo mkdir /etc/httpd
sudo mkdir /etc/httpd/wsgi
sudo /etc/init.d/apache2 reload
cd /opt/graphite/webapp/graphite/
sudo python manage.py syncdb
sudo chown -R www-data:www-data /opt/graphite/storage/
sudo /etc/init.d/apache2 restart
cd /opt/graphite/webapp/graphite
sudo cp local_settings.py.example local_settings.py
cd /opt/graphite/
sudo ./bin/carbon-cache.py start
#to collect some values
cd ~/graphite/graphite/examples
sudo chmod +x example-client.py
sudo ./example-client.py
Set the location of the collectd rrdtool files in Graphite
Then I followed the instructions here http://graphite.readthedocs.org/en/latest/tools.html to set the location of the collectd rrdtool files in Graphite
$ sudo ln -s /var/lib/collectd/rrd/ADE-W08-02 /opt/graphite/storage/rrd/ADE-W08-02
$ sudo ln -s /var/lib/collectd/rrd/tu-mon-01 /opt/graphite/storage/rrd/tu-mon-01
$ sudo ln -s /var/lib/collectd/rrd/tu-sql-01 /opt/graphite/storage/rrd/tu-sql-01
$ sudo ln -s /var/lib/collectd/rrd/tu-web-01 /opt/graphite/storage/rrd/tu-web-01
$ sudo ln -s /var/lib/collectd/rrd/tu-web-02 /opt/graphite/storage/rrd/tu-web-02
$ sudo ln -s /var/lib/collectd/rrd/tu-web-03 /opt/graphite/storage/rrd/tu-web-03
$ sudo ln -s /var/lib/collectd/rrd/tu-web-04 /opt/graphite/storage/rrd/tu-web-04
$ sudo ln -s /var/lib/collectd/rrd/tu-lb-01 /opt/graphite/storage/rrd/tu-lb-01

$ cd /opt/graphite/webapp/graphite
$ sudo vi local_settings.py
TIME_ZONE = 'Europe/Paris'
#for error with log
LOG_RENDERING_PERFORMANCE = True
LOG_CACHE_PERFORMANCE = True
LOG_METRIC_ACCESS = True

WHISPER_DIR = '/opt/graphite/storage/whisper'
RRD_DIR = '/opt/graphite/storage/rrd'
DATA_DIRS = [WHISPER_DIR, RRD_DIR] # Default: set from the above variables
LOG_DIR = '/opt/graphite/storage/log/webapp'
INDEX_FILE = '/opt/graphite/storage/index'  # Search index file
$ sudo apt-get install python-rrdtool
Changing the default refresh interval to 10 sec
Instructions from http://blog.stuartherbert.com/php/2011/09/21/real-time-graphing-with-graphite/
$ sudo vi local_settings.py
DEFAULT_CACHE_DURATION = 10 # Cache images and data for 10s

#below is not necessary, it is just for the composer
$ sudo vi  /opt/graphite/webapp/content/js/composer_widgets.js
//var interval = 60;
var interval = 10;
I had also to change the interval in collectd (write interval in the rrdtool files on the collectd server tu-mon-01):
$ sudo vi /etc/collectd/collectd.conf
<Plugin rrdtool>
  DataDir "/var/lib/collectd/rrd"
  # CacheTimeout 120
  CacheFlush 2
  WritesPerSecond 60
</Plugin>
Building the first dashboard
To build a dashboard, you need first to use the graphite composer to create graphs such as :
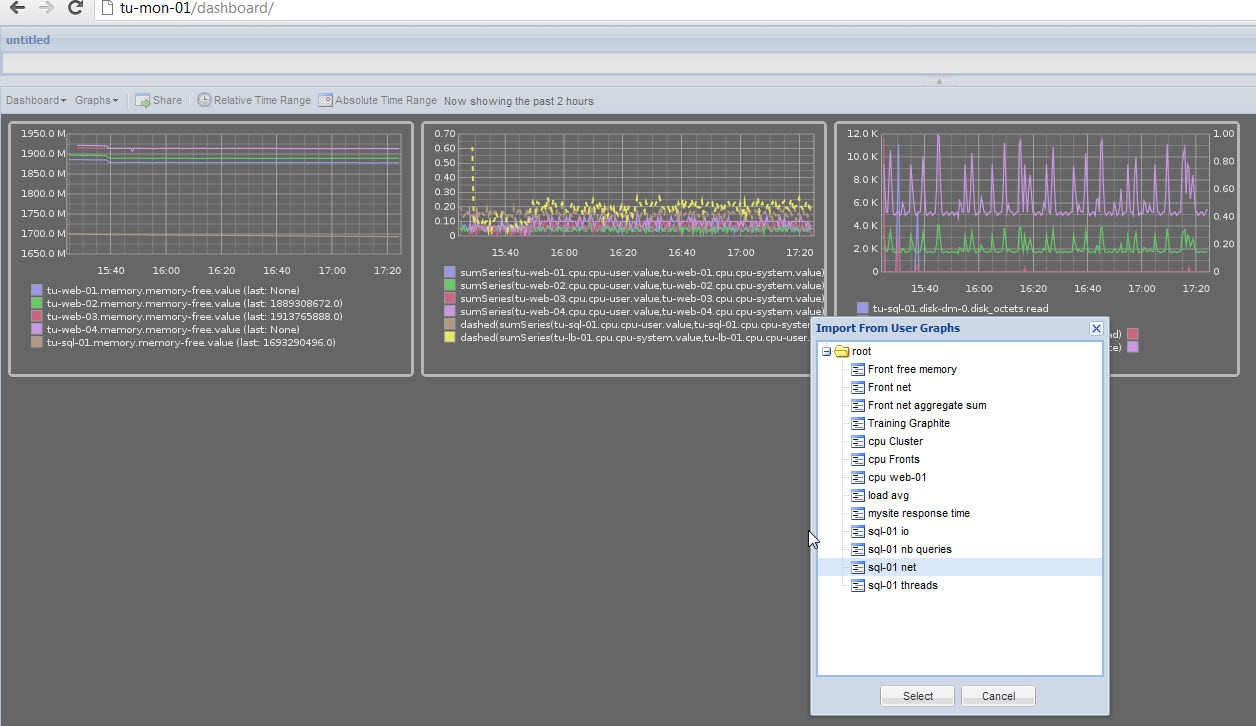
Then you can combine graphs in the Dashboard composer such as:
You save your dashboard and you share it to get the url.
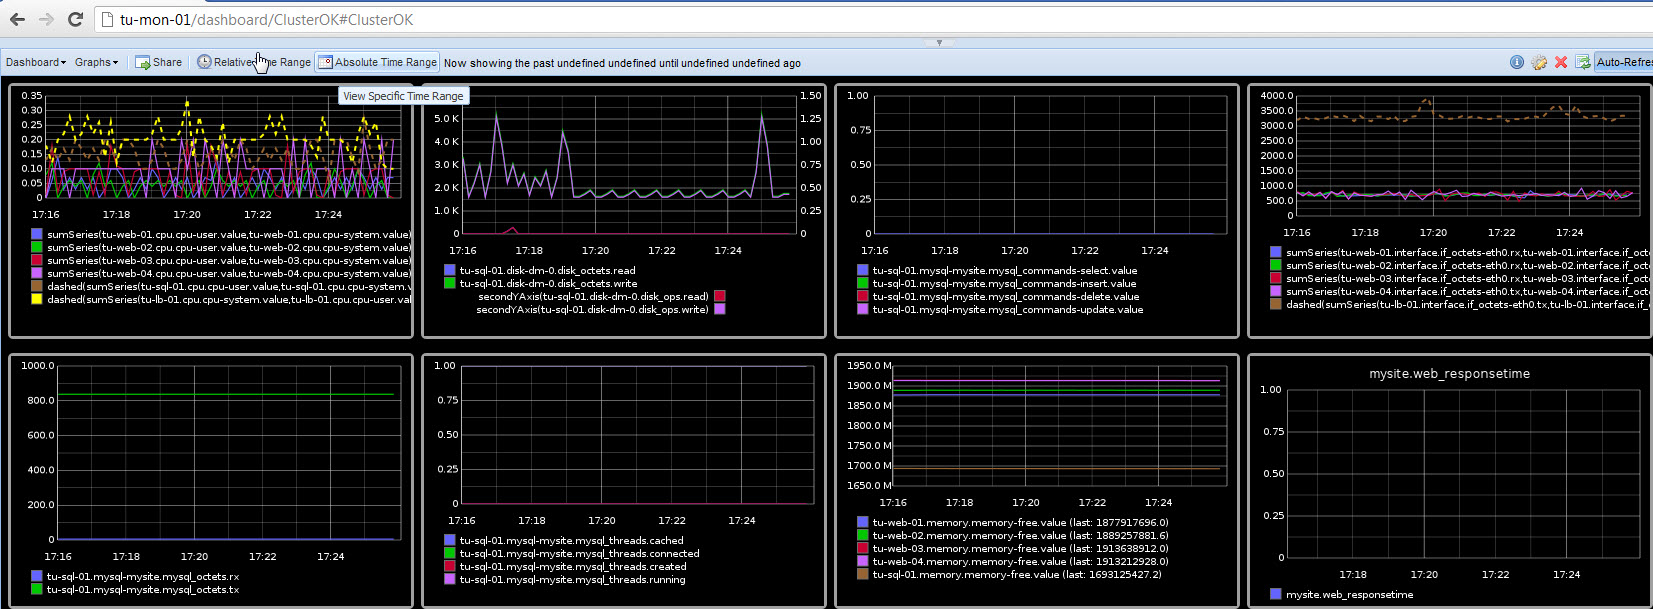
In the example above, you can see that I have all the indicators I need to oversee the cluster:
- CPU on the fronts, the mysql server and the load balancer
- IO on the mysql server
- Number of Selects, Inserts, Delete and Updates commands
- Bandwith on each server (to check that I don’t reach any network limit)
- Bandwith on the mysql server (in this way, I can estimate the HTTP bandwith usage on the fronts because I use the same virtual NIC for the HTTP and the Mysql transport layer)
- Number of mysql threads
- Free memory on each server
Writing a custom Graphite collector to get the response time of the Web Application
With graphite it is very easy to write a custom collector in shell script or python. I wrote this custom collector to check the response time of the application
$ cd graphite/graphite/examples
$ cp example-client.py time-url.py
$ vi time-url.py
$ python time-url.py #see the attached file
see attached file: time-url.py
View the performance counters dashboard while running a stress
With Graphite, I was able to see all the indicators I need while I was running a stress such as:
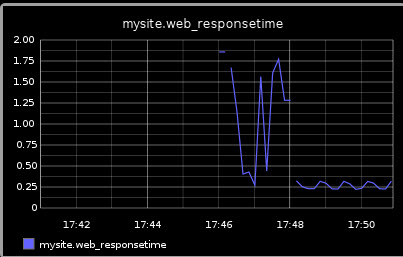
I you can see response time graph shows that the response time increases from 0.25 to 1,75sec during the test.

