Results overview
As I use different generation Hardware to host the VM, I am wondering what could be the influence of the generation of the CPU. A VM with 2 VCPU on a I7 860 @2800 Mhz (2009 Generation, server ade-esxi-03) should run faster than a VM on a Q6600 @2400 Mhz (2007 Generation, server ade-esxi-02).
Not only the CPU is different between the 2 servers, the RAM generation also differs : DDR2@800 and DDR3@1066. Despite the CPU and the RAM, I assume that the others elements (MainBoard, Disks, …) should have minimal impact on the tests as the MainBoard generally represents a few percentage in the difference of performance and the workload is not tied to the IO.
The frequency is 17% faster on the newest one, so at least, I should have this increase of performance; but there are so many parameters that enter in the performance of a CPU for a particular workload (L1, L2 cache and speed, Memory Bus speed, Use of hyper-threading, context switch speed, etc…) that I need to test it.
I assume that the virtualization layer (VMware 5) has no important impact as the 2 CPU use Intel Virtualization Technology, but perhaps I’m wrong…
Any way, what I would like to be sure is that I have equivalent performance of the fronts to have a fair dispatching of the requests by the load balancer when I will test it . So perhaps, I will have to minimize the number of vcpu for the VM hosted on the newest server.
Test #10, APC activated, 1 Front, 1Vcpu, 2GB on server ade-esxi-02 (Intel(R) Core(TM) Quad CPU Q6600 @ 2.40GHz; No Hyperthreading; 8 GB DDR2 800) :
$ ab -kc 10 -n 20 http://tu-web-01/mysite/
Requests per second: 3.15 [#/sec] (mean)
This is ApacheBench, Version 2.3
Copyright 1996 Adam Twiss, Zeus Technology Ltd, http://www.zeustech.net/
Licensed to The Apache Software Foundation, http://www.apache.org/
Benchmarking tu-web-01 (be patient).....done
Server Software: Apache/2.2.22
Server Hostname: tu-web-01
Server Port: 80
Document Path: /mysite/
Document Length: 47895 bytes
Concurrency Level: 10
Time taken for tests: 6.348 seconds
Complete requests: 20
Failed requests: 15
(Connect: 0, Receive: 0, Length: 15, Exceptions: 0)
Write errors: 0
Keep-Alive requests: 0
Total transferred: 968940 bytes
HTML transferred: 957920 bytes
Requests per second: 3.15 [#/sec] (mean)
Time per request: 3174.178 [ms] (mean)
Time per request: 317.418 [ms] (mean, across all concurrent requests)
Transfer rate: 149.05 [Kbytes/sec] received
Connection Times (ms)
min mean[+/-sd] median max
Connect: 0 0 0.8 0 4
Processing: 1729 3066 537.4 2911 4619
Waiting: 1640 2217 497.1 1958 3759
Total: 1729 3066 537.3 2911 4619
Percentage of the requests served within a certain time (ms)
50% 2911
66% 3352
75% 3382
80% 3382
90% 3440
95% 4619
98% 4619
99% 4619
100% 4619 (longest request)
dstat shows 100% CPU
-------cpu0-usage-----------total-cpu-usage---- -net/total- -dsk/total- ---system-- ------memory-usage----- ---load-avg--- ---procs--- ----swap--- ----system----
usr sys idl wai hiq siq:usr sys idl wai hiq siq| recv  send| read  writ| int   csw | used  buff  cach  free| 1m   5m  15m |run blk new| used  free|     time
 71  11  18   0   0   0: 71  11  18   0   0   0| 615k   61k|   0     0 | 717   709 | 272M 22.5M  144M 1565M|2.98 0.85 0.30| 10   0 1.0|   0   508M|22-08 17:13:26
 89  11   0   0   0   0: 89  11   0   0   0   0| 528k  189k|   0     0 |1315  1577 | 316M 22.5M  144M 1521M|2.98 0.85 0.30| 10   0 2.0|   0   508M|22-08 17:13:27
 88  11   0   0   0   1: 88  11   0   0   0   1| 226k  475k|   0     0 | 543   645 | 219M 22.5M  144M 1618M|2.98 0.85 0.30| 12   0 4.0|   0   508M|22-08 17:13:28
 66  34   0   0   0   0: 66  34   0   0   0   0| 508k   65k|   0    40k| 649   766 | 317M 22.5M  144M 1520M|2.98 0.85 0.30| 10   0   0|   0   508M|22-08 17:13:29
 89  11   0   0   0   0: 89  11   0   0   0   0| 223k  131k|   0     0 | 689   776 | 369M 22.5M  144M 1468M|2.98 0.85 0.30| 11   0   0|   0   508M|22-08 17:13:30
 95   5   0   0   0   0: 95   5   0   0   0   0| 307k  356k|   0     0 | 619   458 | 366M 22.5M  144M 1471M|3.54 1.00 0.35|9.0   0   0|   0   508M|22-08 17:13:31
Test #11, APC activated, 1 Front, 1Vcpu, 2GB on server ade-esxi-03 (Intel(R) Core(TM) i7 CPU 860 @ 2.80GHz; Hyperthreading active; 8 GB DDR3 1066) :
$ ab -kc 10 -n 20 http://tu-web-03/mysite/
Requests per second: 5.18 [#/sec] (mean)
This is ApacheBench, Version 2.3
Copyright 1996 Adam Twiss, Zeus Technology Ltd, http://www.zeustech.net/
Licensed to The Apache Software Foundation, http://www.apache.org/
Benchmarking tu-web-03 (be patient).....done
Server Software: Apache/2.2.22
Server Hostname: tu-web-03
Server Port: 80
Document Path: /mysite/
Document Length: 47884 bytes
Concurrency Level: 10
Time taken for tests: 3.862 seconds
Complete requests: 20
Failed requests: 16
(Connect: 0, Receive: 0, Length: 16, Exceptions: 0)
Write errors: 0
Keep-Alive requests: 0
Total transferred: 968654 bytes
HTML transferred: 957634 bytes
Requests per second: 5.18 [#/sec] (mean)
Time per request: 1931.125 [ms] (mean)
Time per request: 193.113 [ms] (mean, across all concurrent requests)
Transfer rate: 244.92 [Kbytes/sec] received
Connection Times (ms)
min mean[+/-sd] median max
Connect: 0 1 1.2 0 4
Processing: 1793 1905 57.4 1920 2026
Waiting: 1196 1282 59.0 1278 1404
Total: 1794 1906 57.5 1924 2026
Percentage of the requests served within a certain time (ms)
50% 1924
66% 1934
75% 1952
80% 1954
90% 1954
95% 2026
98% 2026
99% 2026
100% 2026 (longest request)
dstat shows 100% CPU
-------cpu0-usage-----------total-cpu-usage---- -net/total- -dsk/total- ---system-- ------memory-usage----- ---load-avg--- ---procs--- ----swap--- ----system----
usr sys idl wai hiq siq:usr sys idl wai hiq siq| recv  send| read  writ| int   csw | used  buff  cach  free| 1m   5m  15m |run blk new| used  free|     time
 65   4  31   0   0   0: 65   4  31   0   0   0| 512k   29k|   0     0 | 394   477 | 366M 21.1M  116M 1500M|2.52 0.72 0.33| 10   0   0|   0   508M|22-08 17:35:42
 98   2   0   0   0   0: 98   2   0   0   0   0| 479k  445k|   0     0 | 702   909 | 382M 21.1M  116M 1484M|2.52 0.72 0.33| 10   0 1.0|   0   508M|22-08 17:35:43
 93   6   0   0   0   1: 93   6   0   0   0   1| 705k  217k|   0     0 | 780   929 | 385M 21.1M  116M 1481M|2.52 0.72 0.33| 10   0 2.0|   0   508M|22-08 17:35:44
 97   2   0   1   0   0: 97   2   0   1   0   0| 538k  500k|   0    20k| 671   869 | 397M 21.1M  116M 1469M|2.52 0.72 0.33|7.0 3.0   0|   0   508M|22-08 17:35:45
 17   0  82   0   0   1: 17   0  82   0   0   1|  78k  103k|   0     0 | 170   228 | 334M 21.1M  116M 1532M|2.32 0.71 0.33|  0   0   0|   0   508M|22-08 17:35:46
Test #12, APC activated, 1 Front, 2Vcpu, 2GB on server ade-esxi-02 (Intel(R) Core(TM) Quad CPU Q6600 @ 2.40GHz; No Hyperthreading; 8 GB DDR2 800) :
$ ab -kc 10 -n 20 http://tu-web-01/mysite/
Requests per second: 5.65 [#/sec] (mean)
This is ApacheBench, Version 2.3
Copyright 1996 Adam Twiss, Zeus Technology Ltd, http://www.zeustech.net/
Licensed to The Apache Software Foundation, http://www.apache.org/
Benchmarking tu-web-01 (be patient).....done
Server Software: Apache/2.2.22
Server Hostname: tu-web-01
Server Port: 80
Document Path: /mysite/
Document Length: 47894 bytes
Concurrency Level: 10
Time taken for tests: 3.541 seconds
Complete requests: 20
Failed requests: 13
(Connect: 0, Receive: 0, Length: 13, Exceptions: 0)
Write errors: 0
Keep-Alive requests: 0
Total transferred: 968938 bytes
HTML transferred: 957918 bytes
Requests per second: 5.65 [#/sec] (mean)
Time per request: 1770.372 [ms] (mean)
Time per request: 177.037 [ms] (mean, across all concurrent requests)
Transfer rate: 267.24 [Kbytes/sec] received
Connection Times (ms)
min mean[+/-sd] median max
Connect: 0 1 0.6 0 2
Processing: 1506 1714 123.9 1720 1916
Waiting: 994 1196 100.7 1202 1353
Total: 1506 1714 123.7 1720 1917
WARNING: The median and mean for the initial connection time are not within a normal deviation
These results are probably not that reliable.
Percentage of the requests served within a certain time (ms)
50% 1720
66% 1744
75% 1822
80% 1880
90% 1904
95% 1917
98% 1917
99% 1917
100% 1917 (longest request)
dstat shows 100% CPU
-------cpu0-usage--------------cpu1-usage-----------total-cpu-usage---- -net/total- -dsk/total- ---system-- ------memory-usage----- ---load-avg--- ---procs--- ----swap--- ----system----
usr sys idl wai hiq siq:usr sys idl wai hiq siq:usr sys idl wai hiq siq| recv  send| read  writ| int   csw | used  buff  cach  free| 1m   5m  15m |run blk new| used  free|     time
 87  13   0   0   0   0: 90  10   0   0   0   0: 89  11   0   0   0   0| 413k  126k|   0    20k|1146  1136 | 410M 22.1M  134M 1437M|1.26 0.33 0.12| 10   0   0|   0   508M|22-08 17:38:15
 90  10   0   0   0   0: 87  13   0   0   0   0: 89  12   0   0   0   0| 744k  523k|   0     0 | 991   982 | 355M 22.1M  134M 1492M|1.26 0.33 0.12| 10   0   0|   0   508M|22-08 17:38:16
 92   8   0   0   0   0: 94   6   0   0   0   0: 92   7   0   0   0   0| 490k  332k|   0     0 |1364  1208 | 413M 22.1M  134M 1433M|1.26 0.33 0.12| 10   0   0|   0   508M|22-08 17:38:17
 37   7  56   0   0   0: 32   7  61   0   0   0: 34   7  59   0   0   0| 155k  292k|   0     0 | 420   428 | 311M 22.1M  135M 1535M|1.16 0.32 0.12|  0   0   0|   0   508M|22-08 17:38:18
Test #13, APC activated, 1 Front, 2Vcpu, 2GB on server ade-esxi-03 (Intel(R) Core(TM) i7 CPU 860 @ 2.80GHz; Hyperthreading active; 8 GB DDR3 1066) :
$ ab -kc 10 -n 20 http://tu-web-03/mysite/
Requests per second: 10.10 [#/sec] (mean)
This is ApacheBench, Version 2.3
Copyright 1996 Adam Twiss, Zeus Technology Ltd, http://www.zeustech.net/
Licensed to The Apache Software Foundation, http://www.apache.org/
Benchmarking tu-web-03 (be patient).....done
Server Software: Apache/2.2.22
Server Hostname: tu-web-03
Server Port: 80
Document Path: /mysite/
Document Length: 47884 bytes
Concurrency Level: 10
Time taken for tests: 1.979 seconds
Complete requests: 20
Failed requests: 16
(Connect: 0, Receive: 0, Length: 16, Exceptions: 0)
Write errors: 0
Keep-Alive requests: 0
Total transferred: 968660 bytes
HTML transferred: 957640 bytes
Requests per second: 10.10 [#/sec] (mean)
Time per request: 989.656 [ms] (mean)
Time per request: 98.966 [ms] (mean, across all concurrent requests)
Transfer rate: 477.92 [Kbytes/sec] received
Connection Times (ms)
min mean[+/-sd] median max
Connect: 0 1 0.5 0 2
Processing: 656 924 133.1 960 1143
Waiting: 483 671 103.6 693 907
Total: 656 924 133.1 960 1143
WARNING: The median and mean for the initial connection time are not within a normal deviation
These results are probably not that reliable.
Percentage of the requests served within a certain time (ms)
50% 960
66% 998
75% 1028
80% 1044
90% 1115
95% 1143
98% 1143
99% 1143
100% 1143 (longest request)
dstat shows 100% CPU
-------cpu0-usage--------------cpu1-usage-----------total-cpu-usage---- -net/total- -dsk/total- ---system-- ------memory-usage----- ---load-avg--- ---procs--- ----swap--- ----system----
usr sys idl wai hiq siq:usr sys idl wai hiq siq:usr sys idl wai hiq siq| recv  send| read  writ| int   csw | used  buff  cach  free| 1m   5m  15m |run blk new| used  free|     time
 34   1  65   0   0   0: 34   1  65   0   0   0: 34   2  65   0   0   0| 521k   35k|   0     0 | 505   509 | 323M 20.0M  111M 1549M|   0 0.01 0.01|9.0   0 1.0|   0   508M|22-08 17:42:54
 96   4   0   0   0   0: 98   2   0   0   0   0: 97   3   0   0   0   0|1202k  660k|   0    16k|1640  1781 | 329M 20.0M  111M 1544M|   0 0.01 0.01|9.0   0 2.0|   0   508M|22-08 17:42:55
 56   4  40   0   0   0: 58   1  41   0   0   0: 57   2  41   0   0   0| 585k  596k|   0     0 | 866   979 | 273M 20.0M  111M 1599M|   0 0.01 0.01|  0   0   0|   0   508M|22-08 17:42:56
Test #14, APC activated, 1 Front, 4Vcpu, 2GB on server ade-esxi-02 (Intel(R) Core(TM) Quad CPU Q6600 @ 2.40GHz; No Hyperthreading; 8 GB DDR2 800) :
$ ab -kc 10 -n 20 http://tu-web-01/mysite/
Requests per second: 11.50 [#/sec] (mean)
This is ApacheBench, Version 2.3
Copyright 1996 Adam Twiss, Zeus Technology Ltd, http://www.zeustech.net/
Licensed to The Apache Software Foundation, http://www.apache.org/
Benchmarking tu-web-01 (be patient).....done
Server Software: Apache/2.2.22
Server Hostname: tu-web-01
Server Port: 80
Document Path: /mysite/
Document Length: 47897 bytes
Concurrency Level: 10
Time taken for tests: 1.739 seconds
Complete requests: 20
Failed requests: 17
(Connect: 0, Receive: 0, Length: 17, Exceptions: 0)
Write errors: 0
Keep-Alive requests: 0
Total transferred: 968947 bytes
HTML transferred: 957927 bytes
Requests per second: 11.50 [#/sec] (mean)
Time per request: 869.560 [ms] (mean)
Time per request: 86.956 [ms] (mean, across all concurrent requests)
Transfer rate: 544.09 [Kbytes/sec] received
Connection Times (ms)
min mean[+/-sd] median max
Connect: 0 1 0.6 0 3
Processing: 657 815 114.4 795 1069
Waiting: 477 601 84.0 605 813
Total: 657 816 114.3 797 1069
WARNING: The median and mean for the initial connection time are not within a normal deviation
These results are probably not that reliable.
Percentage of the requests served within a certain time (ms)
50% 797
66% 870
75% 895
80% 939
90% 985
95% 1069
98% 1069
99% 1069
100% 1069 (longest request)
dstat shows 100% CPU
-------cpu0-usage--------------cpu1-usage--------------cpu2-usage--------------cpu3-usage-----------total-cpu-usage---- -net/total- -dsk/total- ---system-- ------memory-usage----- ---load-avg--- ---procs--->
 42   8  49   0   0   1: 45   3  52   0   0   0: 44   6  49   0   0   0: 42   7  51   0   0   0: 44   7  50   0   0   0| 805k  115k|   0     0 |1308  1416 | 354M 22.2M  135M 1492M|1.07 0.28 0.11|9.0   0   0>
 92   7   1   0   0   0: 93   7   0   0   0   0: 87  12   1   0   0   0: 91   8   1   0   0   0: 91   8   1   0   0   0|1372k  865k|   0     0 |2055  1842 | 357M 22.2M  135M 1489M|1.07 0.28 0.11|9.0   0 1.0>
 18   4  78   0   0   0: 17   3  79   1   0   0: 17   1  82   0   0   0: 11   2  87   0   0   0: 16   2  82   1   0   0| 133k  303k|   0     0 | 447   246 | 298M 22.2M  135M 1548M|1.07 0.28 0.11|  0   0   0
Test #15, APC activated, 1 Front, 4Vcpu, 2GB on server ade-esxi-03 (Intel(R) Core(TM) i7 CPU 860 @ 2.80GHz; Hyperthreading active; 8 GB DDR3 1066) :
$ ab -kc 10 -n 100 http://tu-web-03/mysite/
Requests per second: 19.18 [#/sec] (mean)
This is ApacheBench, Version 2.3
Copyright 1996 Adam Twiss, Zeus Technology Ltd, http://www.zeustech.net/
Licensed to The Apache Software Foundation, http://www.apache.org/
Benchmarking tu-web-03 (be patient).....done
Server Software: Apache/2.2.22
Server Hostname: tu-web-03
Server Port: 80
Document Path: /mysite/
Document Length: 47884 bytes
Concurrency Level: 10
Time taken for tests: 5.213 seconds
Complete requests: 100
Failed requests: 88
(Connect: 0, Receive: 0, Length: 88, Exceptions: 0)
Write errors: 0
Keep-Alive requests: 0
Total transferred: 4843294 bytes
HTML transferred: 4788194 bytes
Requests per second: 19.18 [#/sec] (mean)
Time per request: 521.287 [ms] (mean)
Time per request: 52.129 [ms] (mean, across all concurrent requests)
Transfer rate: 907.33 [Kbytes/sec] received
Connection Times (ms)
min mean[+/-sd] median max
Connect: 0 1 0.6 0 3
Processing: 354 504 49.0 500 616
Waiting: 267 374 40.1 372 471
Total: 354 504 49.0 501 616
WARNING: The median and mean for the initial connection time are not within a normal deviation
These results are probably not that reliable.
Percentage of the requests served within a certain time (ms)
50% 501
66% 526
75% 545
80% 551
90% 567
95% 588
98% 597
99% 616
100% 616 (longest request)
dstat shows 100% CPU
-------cpu0-usage--------------cpu1-usage--------------cpu2-usage--------------cpu3-usage-----------total-cpu-usage---- -net/total- -dsk/total- ---system-- ------memory-usage----- ---load-avg--- ---procs--->
usr sys idl wai hiq siq:usr sys idl wai hiq siq:usr sys idl wai hiq siq:usr sys idl wai hiq siq:usr sys idl wai hiq siq| recv  send| read  writ| int   csw | used  buff  cach  free| 1m   5m  15m |run blk new>
 90   6   1   0   0   3: 91   3   6   0   0   0: 98   1   1   0   0   0: 96   2   1   1   0   0: 94   3   3   0   0   1|2282k 1236k|   0    16k|2618  2760 | 350M 20.1M  112M 1521M|2.45 0.64 0.22|9.0   0 2.0>
 93   3   1   1   0   2: 96   4   0   0   0   0: 95   3   1   1   0   0: 95   4   1   0   0   0: 96   4   1   0   0   1|2257k 1281k|   0     0 |2723  2747 | 374M 20.1M  113M 1497M|2.45 0.64 0.22|9.0   0   0>
 93   4   1   0   0   2: 91   5   4   0   0   0: 95   3   2   0   0   0: 93   5   2   0   0   0: 93   5   2   0   0   1|2296k 1265k|   0     0 |2336  2593 | 344M 20.1M  113M 1527M|2.45 0.64 0.22|7.0   0   0>
 95   3   1   0   0   1: 91   3   6   0   0   0: 94   5   1   0   0   0: 93   5   2   0   0   0: 93   4   3   0   0   0|2177k 1242k|   0     0 |2295  2545 | 366M 20.1M  113M 1504M|2.45 0.64 0.22|8.0   0   0>
 21   0  79   0   0   0: 10   1  88   1   0   0:  4   0  96   0   0   0: 11   0  89   0   0   0: 12   1  87   1   0   0| 205k  300k|   0     0 | 409   377 | 286M 20.1M  113M 1585M|2.25 0.63 0.22|  0   0   0>
Rem:
For the test above, I used 100 connections to be sure to get the correct value (20 connections was too short to use 100% CPU). On the Q6600 server, I tested with 100 connections and I got the same result as 20 connections.
Test #16, APC activated, 1 Front, 8Vcpu 4vcpu+Hyperthreading, 2GB on server ade-esxi-03 (Intel(R) Core(TM) i7 CPU 860 @ 2.80GHz; Hyperthreading active; 8 GB DDR3 1066) :
Be aware that the i7 860 does not have 8 cores, here we get advantage of the Hyperthreading techno.
rauburtin@tproj-serv-03:~$ ab -kc 10 -n 100 http://tu-web-03/mysite/
Requests per second: 21.29 [#/sec] (mean)
This is ApacheBench, Version 2.3
Copyright 1996 Adam Twiss, Zeus Technology Ltd, http://www.zeustech.net/
Licensed to The Apache Software Foundation, http://www.apache.org/
Benchmarking tu-web-03 (be patient).....done
Server Software: Apache/2.2.22
Server Hostname: tu-web-03
Server Port: 80
Document Path: /mysite/
Document Length: 47881 bytes
Concurrency Level: 10
Time taken for tests: 4.698 seconds
Complete requests: 100
Failed requests: 91
(Connect: 0, Receive: 0, Length: 91, Exceptions: 0)
Write errors: 0
Keep-Alive requests: 0
Total transferred: 4843280 bytes
HTML transferred: 4788180 bytes
Requests per second: 21.29 [#/sec] (mean)
Time per request: 469.751 [ms] (mean)
Time per request: 46.975 [ms] (mean, across all concurrent requests)
Transfer rate: 1006.87 [Kbytes/sec] received
Connection Times (ms)
min mean[+/-sd] median max
Connect: 0 0 0.5 0 3
Processing: 392 455 31.1 457 529
Waiting: 277 344 32.3 342 409
Total: 392 456 31.1 457 530
Percentage of the requests served within a certain time (ms)
50% 457
66% 468
75% 477
80% 484
90% 497
95% 508
98% 522
99% 530
100% 530 (longest request)
dstat shows 82% Total CPU
-------cpu0-usage--------------cpu1-usage--------------cpu2-usage--------------cpu3-usage--------------cpu4-usage--------------cpu5-usage--------------cpu6-usage--------------cpu7-usage-----------total-cpu-usage---->
usr sys idl wai hiq siq:usr sys idl wai hiq siq:usr sys idl wai hiq siq:usr sys idl wai hiq siq:usr sys idl wai hiq siq:usr sys idl wai hiq siq:usr sys idl wai hiq siq:usr sys idl wai hiq siq:usr sys idl wai hiq siq>

 86   5   4   0   0   5: 81   3  16   0   0   0: 91   2   7   0   0   0: 78   2  20   0   0   0: 83   4  13   0   0   0: 57   2  41   0   0   0: 79   4  17   0   0   0: 92   0   8   0   0   0: 81   3  16   0   0   1>
 86   5   6   0   0   3: 69   1  29   1   0   0: 85   7   8   0   0   0: 78   2  20   0   0   0: 77   3  19   1   0   0: 84   5  11   0   0   0: 81   1  18   0   0   0: 73   4  22   0   0   0: 79   4  17   0   0   0>
 86   4   7   0   0   3: 81   3  16   0   0   0: 86   1  13   0   0   0: 80   2  18   0   0   0: 70   1  29   0   0   0: 84   2  13   1   0   0: 74   2  23   1   0   0: 83   3  14   0   0   0: 80   2  17   0   0   0>
 83   4  11   0   0   2: 68   6  26   0   0   0: 50   2  48   0   0   0: 60   4  34   1   0   0: 71   2  26   1   0   0: 69   2  28   1   0   0: 73   1  26   0   0   0: 77   1  21   1   0   0: 69   3  28   0   0   0>
 53   3  44   0   0   0: 39   0  61   0   0   0: 36   1  63   0   0   0: 36   1  63   0   0   0: 27   1  72   0   0   0: 26   3  71   0   0   0: 28   2  70   0   0   0: 36   2  62   0   0   0: 35   1  63   0   0   0>
Conclusion on hardware generation influence
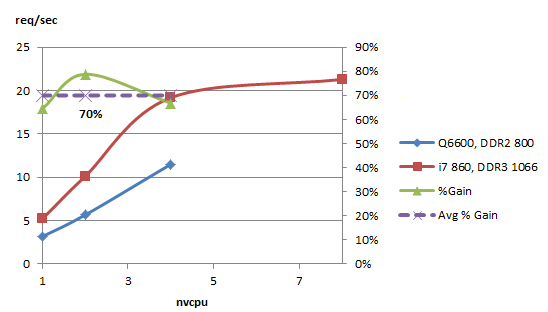
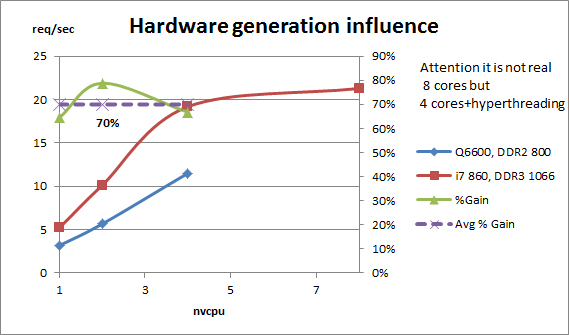
The following graph shows the influence of the generation of Hardware (CPU+RAM) on the performance

Hardware generation CPU influence on req/sec
As you can notice, the couple i7 8600+DDR3 1066 is roughly 70% faster than the couple Q6600+DDR2 800.
Working with 8 vcpu in on the i7 which is 4Cores+Hyperthreading do not give noticed increase of performance for this workload.
Based on this results, I decided to run the load balancing test with 4 VM as follow: Front VM on Q6600 will have 4 cpu (1VM on ade-esxi-01 and 1 VM on ade-esxi-02), Front VM on Core i7 will have 2 vcpu.
Working like this allows me to run 4 VM on the I7 (2 VM for the 2 Fronts, 1 VM for the Load balancer and 1 VM for the monitoring VM)
As a following post will demonstrate it, the VM for the load balancer (haproxy) could run with just 1vcpu and the VM for the monitoring will run with also 1 vcpu
go to Introduction


